

Many traders spend hundreds of hours optimizing indicators, improving entry signals, and refining backtests.
Yet when they deploy their strategies live, performance suddenly deteriorates.
The strategy hasn’t changed.
The market hasn’t changed dramatically.
So what happened?
In many cases, the answer is surprisingly simple:
Slippage.
Slippage is one of the most overlooked factors in algorithmic trading. It can erode algorithmic trading profitability, distort historical results, increase drawdowns, and turn a narrow edge into a losing system.
The challenge is that most traders focus heavily on signal generation while underestimating execution quality.
Professional trading firms understand a different reality:
A profitable strategy is not the same thing as a profitable execution.
This guide explains how slippage works, why it matters, how it affects algorithmic trading systems, and how professional traders manage execution risk in live markets.
- What Is Slippage in Algorithmic Trading?
- How Slippage Works
- Why Slippage Matters More Than Most Traders Realize
- How Slippage Happens
- Positive vs Negative Slippage
- Market Orders vs Limit Orders: Which Creates More Slippage?
- Slippage in Forex vs Stocks vs Crypto
- The Slippage Trap in Backtesting
- How Slippage Impacts Algorithmic Trading Performance
- Real Example: When a Profitable Strategy Fails Because of Slippage
- How Professional Traders Measure Slippage
- How to Reduce Slippage in Algorithmic Trading
- Why Most Retail Trading Bots Ignore Slippage
- The Rise of Execution-Aware Trading Systems
- Can Slippage Be Eliminated Completely?
- Frequently Asked Questions
- What Is an Acceptable Slippage Rate?
What Is Slippage in Algorithmic Trading?
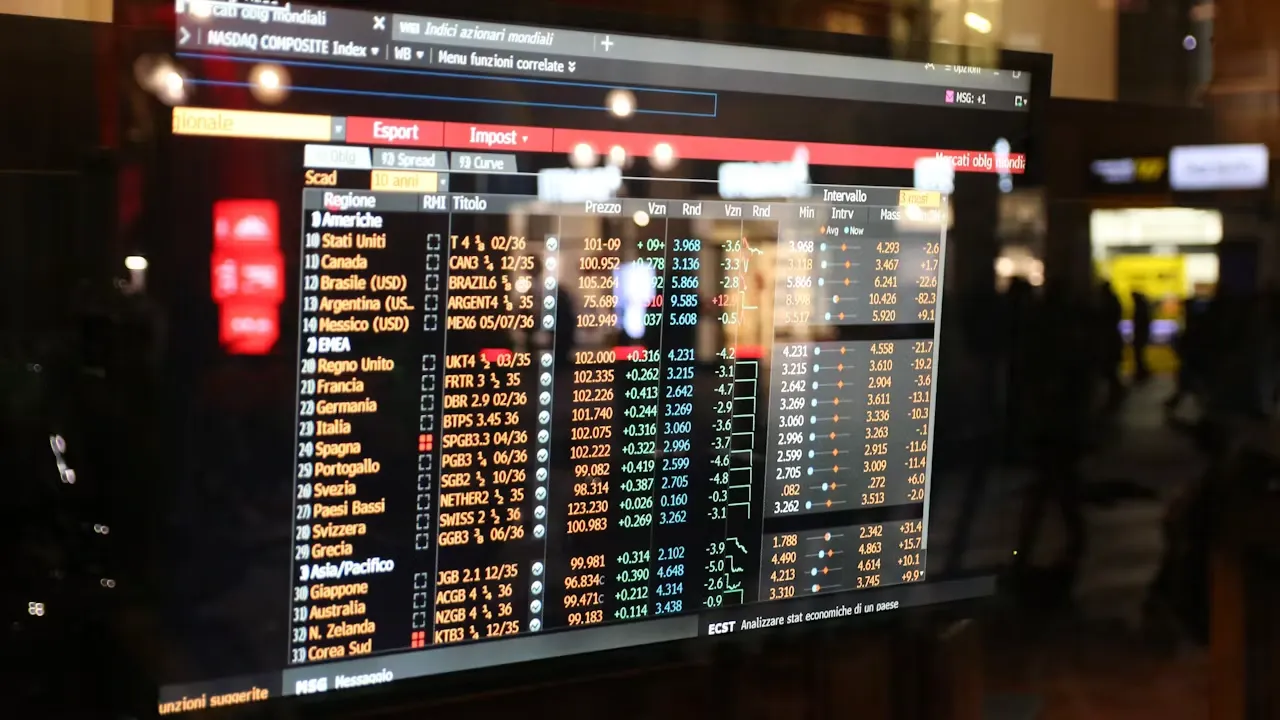
Slippage refers to the difference between the expected execution price of a trade and the actual price at which the trade is filled.
For example:
A trading algorithm submits a buy order at:
$100.00
But the order is executed at:
$100.25
The difference:
$0.25
is slippage.
Slippage occurs across:
- stocks,
- forex,
- crypto,
- futures,
- ETFs,
- and virtually every liquid market.
It is not necessarily a sign of poor strategy design.
Instead, it is often a consequence of market mechanics and execution conditions.
How Slippage Works
Expected Price
The price your strategy expects.
Execution Price
The price actually received.
Difference
The execution gap becomes slippage.

Many traders model commissions.
Fewer model spread costs.
Even fewer model realistic slippage.
That omission can dramatically distort performance expectations.
Why Slippage Matters More Than Most Traders Realize
Many traders assume slippage is a minor cost.
In reality, slippage compounds.
Consider a strategy that executes:
- 500 trades annually
and loses:
- $3 per trade to slippage.
Annual impact:
$1,500
The effect becomes even larger in:
- high-frequency strategies,
- intraday systems,
- low-liquidity assets,
- and volatile markets.
A strategy that appears profitable in backtesting may become marginally profitable—or even unprofitable—once realistic execution costs are introduced.
How Slippage Happens
Several factors contribute to slippage.
Low Liquidity
When insufficient liquidity exists at the desired price level, orders are filled at less favorable prices.
This is common in:
- small-cap stocks,
- low-volume crypto assets,
- and exotic forex pairs.
Market Volatility
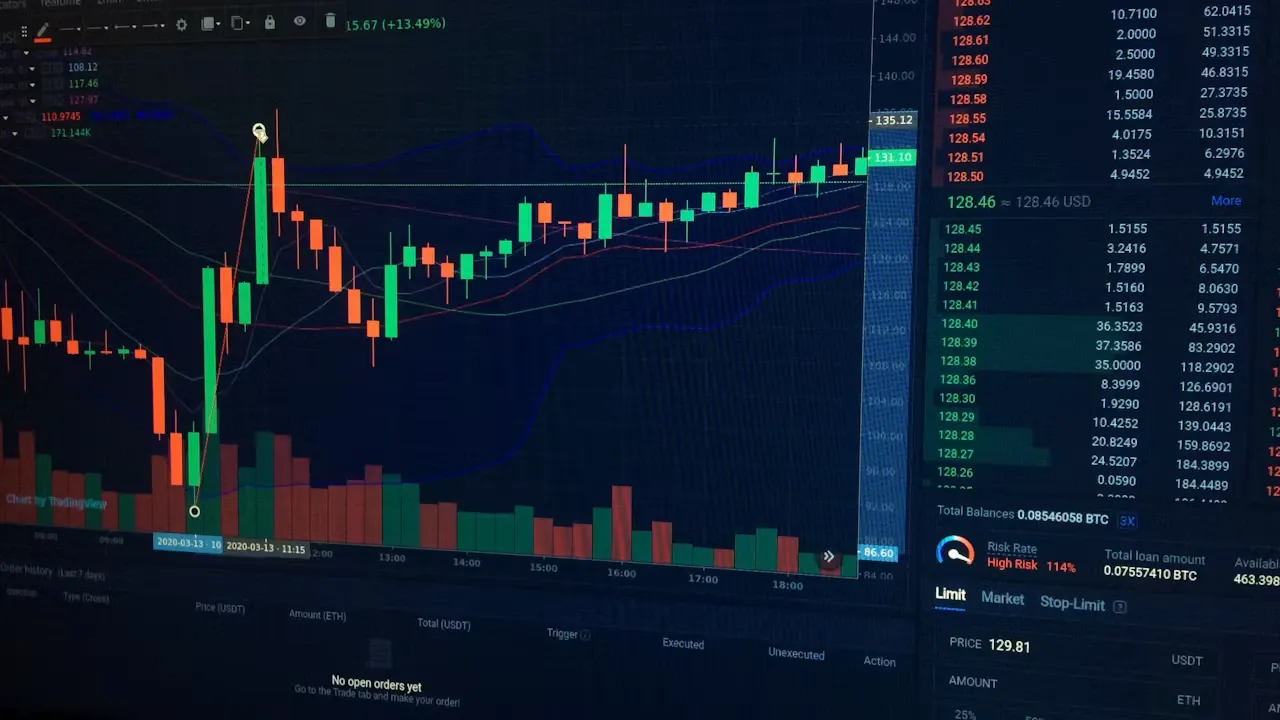
Rapid price movement can cause significant execution gaps.
Examples include:
- CPI releases,
- interest rate decisions,
- earnings announcements,
- major geopolitical events.
Large Order Size
Larger orders often consume multiple price levels within an order book.
This creates additional execution cost.
Execution Delays
Even small delays between signal generation and order routing can affect execution quality.
This becomes increasingly important in fast-moving markets.
Broker and Exchange Routing
Execution quality varies significantly depending on:
- broker infrastructure,
- exchange connectivity,
- routing systems,
- and liquidity access.
Positive vs Negative Slippage
Most traders think of slippage as negative.
But slippage can occasionally work in your favor.
| Type | Description |
|---|---|
| Positive Slippage | Better execution price than expected |
| Negative Slippage | Worse execution price than expected |
In practice, however, most traders experience a net negative effect over time.
Market Orders vs Limit Orders: Which Creates More Slippage?
Order type plays a major role in execution quality.
Different order types create very different slippage profiles.
Market Orders
Market orders prioritize execution speed.
The order is executed immediately at the best available market price.
Advantages:
- fast execution,
- high fill probability,
- immediate market access.
Disadvantages:
- reduced price control,
- increased exposure to slippage,
- greater vulnerability during volatile conditions.
Limit Orders
Limit orders prioritize price control.
The trader defines the maximum buy price or minimum sell price they are willing to accept.
Advantages:
- better price control,
- reduced slippage risk,
- improved execution consistency.
Disadvantages:
- potential missed opportunities,
- lower fill probability,
- possible partial executions.
| Order Type | Typical Slippage Risk |
|---|---|
| Market Order | High |
| Limit Order | Low |
| Stop Market Order | High During Volatility |
| Stop Limit Order | Moderate |
Professional traders typically balance execution certainty and execution quality rather than blindly favoring one order type.
The optimal choice depends on:
- strategy design,
- liquidity conditions,
- volatility,
- and expected holding period.
Slippage in Forex vs Stocks vs Crypto
Slippage behaves differently across markets.
| Market | Typical Slippage Risk |
|---|---|
| Major Forex Pairs | Low to Medium |
| Large-Cap Stocks | Low to Medium |
| ETFs | Low |
| Crypto Markets | Medium to High |
| Small-Cap Stocks | High |
| Illiquid Assets | Very High |
Forex traders often encounter slippage during:
- major economic announcements,
- low-liquidity trading sessions,
- weekend market gaps.
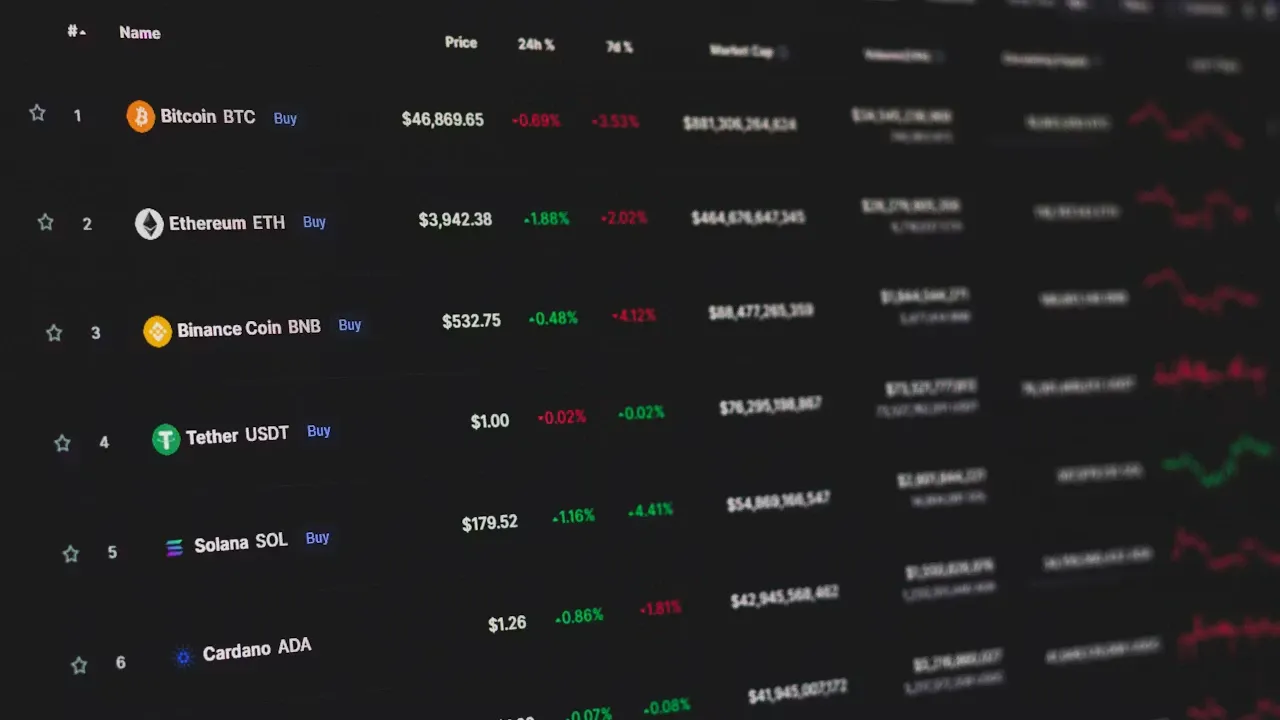
Crypto traders face additional challenges due to fragmented liquidity and exchange-specific conditions.
The Slippage Trap in Backtesting
This is where many algorithmic trading strategies fail.
A realistic trading strategy backtest should model execution costs, fill assumptions, liquidity limits, and order timing instead of assuming perfect fills.
Real markets provide none of these guarantees. Historical results should therefore move into a structured strategy validation process before live capital is deployed.
Consider a strategy with:
| Metric | Backtest |
|---|---|
| Win Rate | 58% |
| Profit Factor | 1.75 |
| Annual Return | 24% |
| Max Drawdown | 11% |
After introducing realistic execution costs:
| Metric | Live Estimate |
|---|---|
| Win Rate | 54% |
| Profit Factor | 1.28 |
| Annual Return | 12% |
| Max Drawdown | 17% |
The strategy remains profitable, but its edge has been reduced substantially. Traders can use AlgoBuild to turn complex trading ideas into backtested algorithms by describing them in plain English, while treating live slippage as a separate execution risk that still requires evaluation.

How Slippage Impacts Algorithmic Trading Performance
Slippage affects multiple trading strategy performance metrics, including win rate, Sharpe Ratio, Profit Factor, drawdown, and stability.
Real Example: When a Profitable Strategy Fails Because of Slippage
Imagine a breakout strategy trading BTC during high-volatility conditions.
Historical testing shows:
- 61% win rate,
- 1.8 profit factor,
- 26% annual return.
Deployment begins.
A major economic announcement triggers:
- increased volatility,
- widening spreads,
- exchange congestion.
The strategy still generates valid signals.
But:
- entries arrive later,
- fills occur at worse prices,
- stop-loss execution deteriorates.
Within months, profit factor declines, drawdowns increase, and performance diverges from the historical test. Comparing backtesting vs forward testing helps show whether this gap appears before meaningful capital is deployed.
The strategy logic remains intact.
The execution environment changes.
This distinction is critical.
How Professional Traders Measure Slippage
Professional trading firms treat slippage as a measurable performance variable.
Common metrics include:
Average Slippage
Average execution difference per trade.
Slippage Cost
Total capital lost due to execution friction.
Fill Rate
Percentage of orders executed as expected.
Execution Quality Score
Overall assessment of routing efficiency and fill quality.

How to Reduce Slippage in Algorithmic Trading
Slippage cannot be eliminated entirely.
But it can be reduced.
Use Limit Orders
Limit orders improve price control.
Trade More Liquid Markets
Liquidity reduces execution friction.
Reduce Position Size
Smaller orders create less market impact. Position sizing, exposure limits, and liquidity rules belong to a broader algorithmic trading risk management framework.
Avoid Major News Releases
Volatility often increases slippage dramatically.

Monitor Live Execution
Execution quality should be measured continuously.
Improve Infrastructure
Professional execution depends on:
- broker connectivity,
- routing quality,
- monitoring systems,
- and deployment reliability.
Why Most Retail Trading Bots Ignore Slippage
Many trading bot builders focus on indicators, signals, optimization, and backtesting while giving far less attention to execution. This is one reason trading bots fail after deployment even when the original strategy logic appears sound.
Execution receives far less attention. A beginner trading bot guide should treat order handling, monitoring, and failure recovery as part of the system rather than as optional additions.
This creates a dangerous misconception.
Traders begin believing:
Better signals automatically create better results.
Professional trading environments operate differently.
They recognize that:
Execution quality is part of the strategy.
A profitable signal with poor execution can easily become unprofitable.
The Rise of Execution-Aware Trading Systems
A mature algorithmic trading workflow evaluates strategy logic, execution quality, latency, monitoring, and operational reliability as one connected process.
This is one reason infrastructure has become a major competitive advantage.
Algorier is an algorithmic trading platform that separates Plain-English strategy creation and backtesting in AlgoBuild from continuous live execution in AlgoRun, where execution quality and slippage become operational concerns.
The goal is no longer:
Generate signals.
The goal is:
Generate signals that survive real-world execution.

Can Slippage Be Eliminated Completely?
No.
Every market contains some degree of execution friction.
The objective is not eliminating slippage entirely.
The objective is:
- measuring it,
- controlling it,
- minimizing its impact,
- and incorporating it into realistic performance expectations.
Professional traders understand this distinction.
Retail traders often discover it the hard way.
Frequently Asked Questions
What is slippage in trading?
actual execution price received.
Is slippage good or bad?
What causes slippage in forex?
Common causes include:
- economic news releases,
- liquidity shortages,
- market volatility,
- and broker execution quality.
How much slippage is acceptable?
The answer depends on:
- market,
- strategy,
- timeframe,
- and expected edge.
Professional traders measure acceptable slippage relative to overall
profitability.
Can slippage make a profitable strategy unprofitable?
Yes. Slippage is one reason live performance can diverge from historical results, especially when the strategy has a narrow edge or trades frequently.
How do algorithmic traders reduce slippage?
They use:
- better execution infrastructure,
- liquidity-aware execution,
- position sizing controls,
- monitoring systems,
- and realistic backtesting assumptions.
What Is an Acceptable Slippage Rate?
There is no universal answer.
Acceptable slippage depends on:
- asset class,
- trade frequency,
- average position size,
- market liquidity,
- and expected strategy edge.
For long-term position traders, small execution differences may have minimal impact.
For short-term algorithmic systems, even a few basis points of slippage can materially reduce profitability.
The most important objective is consistency.
Professional traders focus on maintaining predictable and measurable execution costs rather than attempting to eliminate slippage entirely.
Risk Disclaimer
Trading involves risk, including the potential loss of capital. Past performance does not guarantee future results. Slippage, execution costs, and market conditions can significantly impact strategy performance.
About the Author
The Algorier research team focuses on:
- algorithmic trading systems,
- execution infrastructure,
- deployment workflows,
- portfolio automation,
- and systematic trading operations.
Research for this guide included analysis of:
- execution quality frameworks,
- slippage modeling,
- algorithmic trading deployment,
- and live trading performance degradation factors.