
- Quick Answer
- How Trend Following Works
- Trend Following Is Reactive, Not Predictive
- Trend Following Does Not Require One Specific Indicator
- Trend Following Can Be Long, Short, or Both
- The Hypothesis Behind Trend Following
- The Anatomy of a Trend-Following Strategy
- Common Ways to Identify a Trend
- Trend Following Strategy Example
- Trend Following vs Momentum Trading
- Where Trend Following May Work Best
- Where Trend Following Struggles
- How to Backtest a Trend-Following Strategy
- Common Trend-Following Mistakes
- Trend following is particularly well suited to rule-based implementation because the strategy can be expressed as explicit conditions.
- From Trading Idea to Testable Rules
- Why the Difference Matters
- Trend-Following Strategy Checklist
- How to Decide Whether a Trend-Following Strategy Is Worth Further Testing
- Final Verdict
- Frequently Asked Questions
Introduction
Trend following is one of the most established ideas in systematic trading, but it is also one of the easiest to oversimplify.
At its core, a trend following strategy attempts to participate in sustained directional price movements. Instead of predicting exactly where a market will turn, the strategy waits for evidence that a move is already developing, enters according to predefined rules, and remains exposed while the trend persists.
That sounds simple. Building a usable trend following system is not.
A complete strategy needs to answer several separate questions. How is a trend defined? What confirms an entry? What invalidates the trade? When should a profitable position be closed? How much capital should be exposed? What happens when the market repeatedly changes direction?
These choices matter because trend following comes with an unavoidable tradeoff. A system must react slowly enough to avoid treating every small price fluctuation as a new trend, but quickly enough to capture meaningful moves before too much of the opportunity has passed.
The result is not a single indicator or universal set of parameters. Trend following is better understood as a strategy architecture that can be implemented through moving averages, price breakouts, momentum measures, channel rules, multi-timeframe signals, or combinations of these methods.
This guide explains how that architecture works, the hypothesis behind it, the components a complete trend following strategy requires, and the practical limitations traders need to consider before testing one.
Quick Answer
A trend following strategy is a rule-based trading approach designed to participate in sustained price movements rather than predict exact market turning points. Traders define how a trend is identified, when to enter, when to exit, and how much risk to take. Common implementations use moving averages, price breakouts, momentum measures, or combinations of these signals.
How Trend Following Works
The central idea behind trend following is straightforward:
If a meaningful directional move has developed, the strategy assumes that the movement may continue long enough to justify taking a position.
A trend follower therefore does not need to identify the exact market bottom before buying or the exact top before selling.
Consider a market that has been falling for several weeks and suddenly begins rising.
A predictive strategy might attempt to identify the precise reversal point before the new trend becomes obvious.
A trend following system approaches the problem differently. It may wait until price exceeds a previous high, crosses above a moving average, records sufficiently positive momentum, or satisfies several trend conditions at the same time.
That means the strategy intentionally gives up part of the beginning of the move in exchange for additional evidence that a trend may actually exist.
The same principle applies to exits.
A trend follower generally does not know when a trend has reached its highest or lowest possible price. Instead, the system remains in the position until predefined evidence suggests that the trend has weakened, reversed, or violated the strategy’s rules.
The basic process is therefore:
Detect a possible trend → confirm the entry → establish the position → remain exposed while the trend persists → exit when the trend condition fails

Trend Following Is Reactive, Not Predictive
This distinction is fundamental.
A trend following strategy usually asks:
What is price doing now, and does that behavior satisfy the conditions required for a trend?
It does not need to answer:
What will the market price be next Tuesday?
The strategy still relies on an assumption about future behavior. If it enters because a trend has already formed, it is implicitly assuming that enough directional persistence may remain after entry to offset losing trades, transaction costs, and failed signals.
But the actual trading decision is based on observable rules rather than a requirement to forecast an exact future price.
Trend Following Does Not Require One Specific Indicator
Another common mistake is treating trend following as synonymous with moving averages.
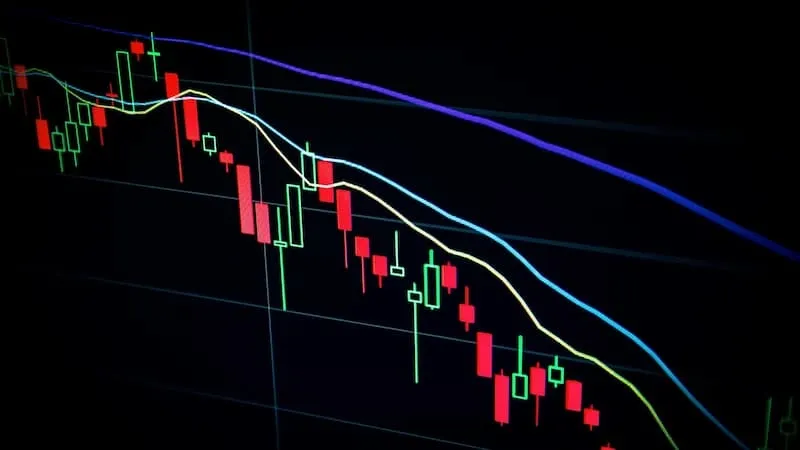
Moving averages are one implementation, not the strategy itself.
A trader could define a trend using:
- a moving average relationship
- a breakout above or below a previous price range
- positive or negative returns over a lookback period
- channel highs and lows
- price relative to a long-term reference level
- confirmation across multiple timeframes
- combinations of price, momentum, and volatility conditions
Two strategies can therefore both be classified as trend following while generating very different trades.
The important question is not which indicator appears on the chart. It is whether the rules are designed to enter and remain exposed to directional persistence.
Trend Following Can Be Long, Short, or Both
Trend following is also not inherently bullish.
A long-only system can use trend rules to determine when to enter and exit rising markets. A two-sided system can potentially take long positions during upward trends and short positions during downward trends, assuming the relevant market and trading instrument allow short exposure.
Academic research on systematic trend following frequently studies both directions. For example, Moskowitz, Ooi, and Pedersen examined time-series momentum across 58 liquid equity index, currency, commodity, and bond futures. Their results documented return persistence over intermediate horizons and formed an important empirical foundation for systematic trend-following research.
That evidence does not mean every trend rule, market, or timeframe will be profitable. It shows why directional persistence is a legitimate hypothesis to test rather than merely a charting convention.
The Hypothesis Behind Trend Following
Every trading strategy needs a reason why its rules might capture something persistent rather than random noise.
For trend following, the hypothesis is that price movements can sometimes persist instead of immediately reversing.
Suppose an asset rises significantly.
A perfectly efficient and instantly adjusting market would make it difficult to justify buying simply because the asset had already risen. Past direction alone should not reliably provide useful information about future direction.
Real markets, however, contain participants operating at different speeds, with different information, constraints, incentives, time horizons, and decision processes. Information may be incorporated gradually. Large investors may need time to adjust positions. Market participants may react slowly to new conditions or later reinforce an existing move.
Several mechanisms have therefore been proposed to explain why trends may emerge and persist.
Gradual Adjustment to New Information
Markets do not always transition from one equilibrium to another instantly.
New economic information, policy changes, earnings expectations, changes in supply and demand, or shifts in investor positioning can affect market participants over different time horizons.
If repricing occurs gradually, a directional move may persist long enough for a trend following system to participate after the initial move has already started.
Behavioral Persistence
Investor behavior can also contribute to directional continuation.
Underreaction may cause an initial price response to develop gradually. Later, stronger participation or delayed reactions can extend the move.
Moskowitz, Ooi, and Pedersen found evidence of time-series momentum across multiple futures markets and reported persistence in returns over horizons of approximately one to twelve months in their sample, followed by partial reversal over longer horizons. They discussed behavioral explanations involving delayed reaction and eventual overreaction, although those explanations should not be treated as the only possible cause of the observed effect.
Institutional and Positioning Effects
Some market participants cannot change exposures instantly.
Large portfolios may require gradual execution. Risk limits can force reductions after sustained losses. Volatility changes may lead investors to scale positions. Hedging demand can also persist rather than appearing in a single transaction.
These processes can contribute to extended directional flows, although a trend follower does not need to know which specific mechanism caused each trend.
The trading system only needs a measurable rule for deciding whether the resulting price behavior is worth following.
Evidence Across Long Historical Periods
Trend-following research is not limited to one recent market cycle.
Hurst, Ooi, and Pedersen constructed a historical time-series momentum strategy across global markets extending back to 1880. Their study reported positive average strategy returns across each decade in their historical sample, although the analysis relies on reconstructed historical data and specific portfolio construction assumptions.
That distinction matters.
Historical evidence supports the idea that trend persistence has appeared repeatedly across different markets and economic environments. It does not establish that a particular moving average, breakout period, asset, or future implementation will remain profitable.
A strategy still has to survive realistic costs, parameter sensitivity, changing market behavior, and out-of-sample testing.
The correct conclusion is therefore not:
Markets trend, so trend following works.
It is:
Markets have exhibited measurable directional persistence in historical data, which gives trend following a hypothesis worth testing under realistic conditions.
The Anatomy of a Trend-Following Strategy
A usable trend following strategy requires more than a trend indicator.
At minimum, the system must define five components:
- Trend definition
- Entry rule
- Exit rule
- Position sizing
- Risk controls
If any of these remain subjective, the strategy is not yet fully specified.
1. Trend Definition
The first question is deceptively simple:
What exactly counts as a trend?
Saying “buy when the market is trending upward” is not an executable rule.
The strategy needs an observable condition.
For example, a system might define an upward trend when:
- price is above a long-term moving average
- a faster moving average is above a slower moving average
- price closes above the highest price of a defined previous period
- returns over a specified lookback period are positive
- several trend conditions agree across different timeframes
The exact rule is less important than making it explicit.
A strategy should produce the same trend classification when given the same data, regardless of who evaluates it.
This is the difference between a trading idea and a testable trading rule.
2. Entry Rule
Trend identification and trade entry do not necessarily have to be the same event.
A strategy might first classify the market as trending and then require a second condition before entering.
For example:
- Trend condition: price is above a long-term moving average.
- Entry condition: price breaks above the highest close of the previous 20 periods.
This separation can help distinguish the broader market environment from the specific event that triggers a position.
 ade entry do not have to be the same event.
Other systems use a single rule for both purposes. A moving average crossover, for instance, may simultaneously classify the direction and trigger the entry.
Neither architecture is automatically better.
What matters is that the entry rule answers four questions clearly:
- What must happen?
- On which timeframe?
- At what point is the condition evaluated?
- When is the resulting order assumed to execute?
That last question becomes especially important during backtesting. A strategy that uses information from a completed candle cannot realistically assume execution before that information became available.
The general issue of timestamp integrity deserves separate treatment in a backtesting framework. For a trend following system, the immediate requirement is simpler: the signal and assumed execution must occur in the correct chronological order.
3. Exit Rule
Entries get most of the attention in trading content. For trend following, exits are often just as important.
A trend follower usually wants two things that naturally conflict:
Exit failed trends before losses become excessive, but avoid exiting successful trends because of ordinary short-term noise.
An exit that reacts too quickly can repeatedly remove the strategy from valid trends.
An exit that reacts too slowly can return a large portion of an open gain before recognizing that the trend has ended.
Common trend-oriented exit structures include:
- an opposite moving average signal
- a break of a trailing price channel
- a trailing stop
- a volatility-adjusted trailing exit
- an opposite momentum condition
- a maximum holding rule
- a combination of trend failure and protective risk rules
There is no universal exit speed that solves the problem.
Faster exits tend to react earlier but can produce more false exits. Slower exits can stay with trends longer but accept larger reversals before closing.
That tradeoff is part of the strategy design itself.
4. Position Sizing
A signal determines whether to trade.
Position sizing determines how much to trade.
Those are different decisions.
Two traders can use identical trend signals and experience very different outcomes if one allocates substantially more capital to each position.
A systematic trend strategy therefore needs an explicit method for translating a signal into exposure.
Possible approaches include:
- fixed position size
- fixed percentage of available capital
- volatility-adjusted sizing
- risk-based sizing using distance to a protective exit
The choice should match the strategy’s intended use and the characteristics of the market being traded.
What should be avoided is allowing position size to become an emotional decision made after the signal appears. Once sizing changes arbitrarily from trade to trade, the behavior being tested is no longer the same behavior being traded.
5. Risk Controls
Trend following assumes that many apparent trends will fail.
That is not an edge case. It is a fundamental property of the strategy.
Markets can break out and reverse. Moving averages can cross repeatedly in a narrow range. A strong directional move can disappear almost immediately after entry.
A complete system therefore needs explicit rules for what happens when the expected trend does not develop.
Depending on the strategy, those rules may address:
- maximum risk per position
- protective exits
- total simultaneous exposure
- concentration across correlated markets
- maximum acceptable strategy-level loss
- conditions that temporarily prevent new entries
These controls should not be confused with the trend signal itself.
The signal answers:
Is there evidence of a trend worth trading?
Risk management answers:
If that interpretation is wrong, how much are we willing to lose?
Keeping those questions separate makes the strategy easier to analyze, test, and modify without accidentally changing several parts of the system at once.
Common Ways to Identify a Trend
There is no universal trend signal.
Different trend-following systems can interpret the same market differently because they use different definitions of direction, persistence, and confirmation. One system may react quickly to a new move, while another waits for much stronger evidence before changing position.
The most common approaches fall into several broad categories.
Moving Average Methods
Moving averages reduce short-term price fluctuations into a smoother representation of direction.
A basic trend rule might classify the market as bullish when price is above a long-term moving average and bearish when price is below it.
Another common structure compares two averages:
- faster average above slower average: positive trend condition
- faster average below slower average: negative trend condition
The attraction of moving-average systems is not that the averages predict future prices. They provide a consistent method for deciding whether recent prices are stronger or weaker than a slower-moving reference.
The tradeoff is lag.
A slower average can filter out more noise, but it will usually recognize a change in direction later. A faster system responds earlier but may change direction repeatedly during unstable or sideways conditions.
Research into trend-following filters also shows that the appropriate timescale cannot be separated from transaction costs and the persistence characteristics of the underlying market. In other words, simply making a trend system faster does not necessarily make it better.
For this reason, moving-average parameters should be treated as strategy variables to test, not magical numbers that define a universally superior trend system.
Price and Channel Breakouts
A breakout strategy defines trend evidence directly from price.
Instead of asking whether one average is above another, the system asks whether price has moved beyond a previously established range.

For example:
- enter long after price closes above the highest price of a defined lookback window
- enter short after price closes below the lowest price of that window
This approach has an intuitive connection to trend following.
A new high suggests that buyers have pushed price beyond its recent range. A new low suggests the opposite. If the movement develops into a persistent trend, the system remains exposed. If the breakout fails, the exit rules determine how quickly the position is closed.
The challenge is that markets frequently move beyond recent boundaries without developing sustained directional behavior.
A breakout is therefore not evidence that a profitable trend will follow. It is simply an observable event that can serve as a systematic entry condition.
Longer breakout windows generally require a more substantial move before entry. Shorter windows respond more quickly but may generate more frequent signals.
Again, neither is inherently superior. The relevant question is whether the complete rule set remains viable after realistic trading costs and across market conditions not used to select the parameter.
Momentum-Based Methods
Another implementation measures the direction of past returns.
A simple time-series momentum rule can ask whether an asset’s return over a specified previous period was positive or negative.
Positive past return can produce a long signal. Negative past return can produce a short signal, assuming short exposure is available.
This approach has been extensively studied in academic finance. Moskowitz, Ooi, and Pedersen documented time-series momentum across 58 liquid futures instruments spanning equity indexes, currencies, commodities, and bonds. Importantly, time-series momentum compares an asset’s recent performance with its own history rather than ranking it against other assets.
This distinction becomes important because the word momentum is used for several different strategy families.
A rule such as:
Buy the strongest five stocks relative to the rest of the market.
is conceptually different from:
Buy an asset when its own historical return is positive.
The first is cross-sectional. The second is time-series.
Trend-following systems are often closely connected to the second framework.
Multi-Timeframe Confirmation
A trend can also be evaluated at more than one timescale.
For example, a system might require:
- positive long-term trend on the daily timeframe
- positive intermediate trend on the four-hour timeframe
- a specific entry trigger on the one-hour timeframe
The intention is usually to prevent a short-term signal from being traded against a broader directional environment.
This sounds attractive, but adding confirmation rules creates another risk: complexity.
Every additional timeframe, lookback, threshold, and confirmation condition becomes another parameter that can be selected after examining historical results.
A five-condition strategy is not necessarily more robust than a one-condition strategy. It may simply have more opportunities to fit historical noise.
Multi-timeframe confirmation should therefore have a clear role in the strategy rather than being added because it improved one backtest.
Trend Following Strategy Example
Consider a simplified system designed to demonstrate how the pieces fit together.
Illustrative example only. This is not a recommendation and does not represent actual strategy performance.
Assume the system trades one liquid market on daily data.
Trend Rule
The market is considered to be in an upward trend when:
- the closing price is above its 200-period moving average
The system does not take new long positions when price is below that reference.
Entry Rule
While the positive trend condition is active:
- enter long when price closes above the highest close of the previous 20 completed periods
The strategy waits until the current period has closed before confirming the signal.
Exit Rule
Close the position when either:
- price closes below a defined trailing exit level, or
- the broader trend condition is no longer satisfied
The trailing exit should itself be precisely defined before testing. It cannot simply be described as “exit when the trend looks weak.”
Position Sizing
The system allocates exposure according to a predefined sizing rule rather than changing trade size based on confidence in individual signals.
The exact sizing method is deliberately unspecified here because there is no universal allocation appropriate for every account, market, or volatility environment.
Risk Controls
The system also defines:
- maximum exposure per position
- maximum number of simultaneous positions
- conditions under which new entries are suspended
The important point is the architecture.
The strategy is not merely:
Buy above the 200-day moving average.
It contains a market filter, entry condition, exit mechanism, sizing method, and risk framework.
Change any one of those components and you may materially change the strategy.
That is why two systems described casually as “200-day moving-average strategies” can behave very differently in practice.
Trend Following vs Momentum Trading
Trend following and momentum trading overlap, but treating them as perfect synonyms creates unnecessary confusion.
Both are based on some form of directional persistence. Both can use past price behavior to determine whether continued exposure in the same direction is justified.
The difference is mainly one of scope.
Trend following is a broad strategy family. It can use moving averages, breakouts, channels, return-based momentum, or other systematic definitions of directional movement.
Momentum describes persistence more specifically and can refer to different constructions.
Time-series momentum asks whether an asset’s own past return predicts its subsequent direction.
Cross-sectional momentum asks which assets have performed better or worse relative to other assets and constructs positions based on those rankings.
These approaches are related, but they should not be collapsed into one definition. Academic work distinguishes time-series momentum from cross-sectional momentum precisely because their signals and portfolio construction differ.
A moving-average crossover strategy can therefore be a trend-following system without being identical to a conventional academic time-series momentum rule.
Likewise, a cross-sectional stock momentum portfolio is not automatically a trend-following strategy in the sense used throughout this guide.
This distinction matters when evaluating research. Evidence supporting one momentum construction should not automatically be treated as proof that every strategy carrying a “trend” or “momentum” label will behave similarly.
Where Trend Following May Work Best
Trend following depends on directional persistence.
Its most favorable environment is therefore not simply a rising market or a falling market. It is a market in which directional moves are sufficiently persistent for successful trends to compensate for failed signals and trading costs.
Several characteristics can make that more likely.
Sustained Directional Moves
Long, relatively persistent trends give the strategy time to participate after its delayed entry.
Remember that trend following normally sacrifices the earliest portion of a move because it waits for confirmation.
If the trend continues substantially after entry, that delay may be acceptable.
If every movement reverses shortly after becoming detectable, the structure becomes much less favorable.
Large Market Moves
Trend-following systems can sometimes benefit disproportionately from relatively infrequent large moves.
This helps explain why judging a trend strategy solely by win rate can be misleading.
A system can experience numerous small failed signals while depending on fewer sustained moves for a substantial portion of its long-run result. Models of trend-following returns have also documented the tendency toward asymmetric payoff structures in which repeated smaller losses can coexist with less frequent larger gains.
That does not mean every trend system will exhibit the same distribution. Exit design, sizing, markets, and signal speed can all change the outcome.
Diversified Opportunity Sets
Many institutional trend-following studies do not rely on one market.
They apply related directional rules across futures covering several asset classes. One reason is straightforward: a trader cannot know in advance where the next sustained trend will occur.
The historical evidence reported by Moskowitz, Ooi, and Pedersen and later by Hurst, Ooi, and Pedersen was constructed across diversified sets of global markets rather than a single instrument.
That does not mean diversification automatically creates an edge. It means evidence from diversified trend portfolios should not be carelessly used to justify expectations for a standalone strategy on one market.
A Bitcoin trend system and a diversified futures trend portfolio are not the same thing.
Where Trend Following Struggles
The weakness of trend following follows directly from its strength.
The strategy deliberately reacts to directional movement after it begins. When apparent trends fail repeatedly, that same behavior can generate repeated losing trades.
Sideways and Choppy Markets
Suppose price moves upward enough to trigger a long signal, reverses, triggers an exit, falls enough to trigger a short signal, and then reverses again.
The system can be wrong in both directions.
This pattern is commonly called whipsaw.
Whipsaw is not necessarily evidence that the strategy is broken. Some failed signals are the cost of waiting for the relatively small number of movements that eventually become meaningful trends.
The problem appears when failed signals occur frequently enough that subsequent trends cannot compensate for them.
Sudden Reversals
Trend following is reactive.
That means a system that is correctly positioned during a strong trend may still surrender part of its unrealized gain before the exit condition recognizes a reversal.
Faster exits can reduce that delay, but making an exit increasingly sensitive can also cause the strategy to leave valid trends because of ordinary volatility.
The goal is therefore not to design an exit that catches every market top or bottom. Doing so retrospectively is easy. Doing it consistently using information available at the time is a different problem.
High Trading Costs Relative to the Edge
Faster systems generally create more turnover.
More turnover increases the importance of:
- bid and ask spreads
- commissions and fees
- slippage
- market impact
- execution delay
A strategy that produces an attractive gross backtest can become unattractive after realistic implementation costs.
Recent research has also challenged the assumption that trend-following behavior is equally persistent at every speed and in every market structure. A 2026 study examining roughly 100 liquid futures contracts from 1995 through 2025 found substantial deterioration in short-term trend performance after approximately 2009, with results varying according to signal horizon and market microstructure.
That result should not be generalized into “trend following no longer works.” It makes the narrower point that signal speed, trading costs, and market structure matter, especially when evaluating short-horizon implementations.
For a deeper treatment of execution effects, see the dedicated guide to slippage in algorithmic trading rather than assuming a backtest execution price will always be available in live trading.
Rapidly Changing Regimes
A system calibrated during a prolonged trending period may look excellent precisely because that environment favored its structure.
The danger is then assuming that historical behavior represents a permanent property of the market.
A trend system should therefore be evaluated across:
- strong trends
- weak trends
- range-bound markets
- high-volatility periods
- quieter periods
- abrupt reversals
The objective is not to prove that the strategy works everywhere.
Very few trading strategies should be expected to do that.
The objective is to understand where the strategy depends on particular market behavior and what happens when that behavior disappears.
How to Backtest a Trend-Following Strategy
Backtesting a trend strategy should answer a specific question:
Would these exact rules have produced acceptable behavior when applied chronologically to historical data under assumptions that could reasonably have existed in real trading?
The full methodology of backtesting is covered in Algorier’s Complete Backtesting Guide, so it does not need to be rebuilt here.
For trend following specifically, several issues deserve extra attention.
Test More Than the Parameter That Looked Best
Suppose a moving-average system performs best historically with a 173-period lookback.
That does not automatically make 173 meaningful.
If 160, 170, 180, and 190 periods produce broadly similar behavior, the strategy may be capturing something relatively stable.
If 173 works exceptionally well while nearby values collapse, the result deserves far more skepticism.
The objective is not to find the historically perfect parameter.
It is to determine whether the basic strategy logic survives reasonable variation.
This is a trend-specific application of the broader principles covered in Trading Strategy Robustness Testing.
Include Unfavorable Regimes
A backtest containing only a strong bull market tells you very little about the full behavior of a trend-following system.
The test should include periods in which directional persistence was weak, markets reversed aggressively, or extended ranges produced repeated false signals.
A useful backtest should expose the strategy to the conditions most likely to hurt it.
Otherwise, the test is functioning as marketing material rather than evidence.
Keep Signal Timing Chronologically Valid
If a trend condition depends on the closing price of a period, that closing price must exist before the strategy acts on it.
This sounds obvious, but small timing mistakes can allow a backtest to use information that would not yet have been known.
Trend systems involving:
- bar closes
- rolling highs and lows
- moving averages
- multi-timeframe conditions
need particularly clear timestamp rules.
The broader problem is covered in the dedicated guide to look-ahead bias in backtesting. For this strategy, the key requirement is simply that every decision uses only information available when the decision could actually have been made.
Model Costs at the Strategy’s Actual Turnover
Execution assumptions should reflect how frequently the system trades.
A slow trend strategy that changes position a handful of times per year has a different cost profile from a short-horizon system that repeatedly enters and exits during noisy markets.
Do not apply the same generic transaction-cost assumption to every trend design without checking whether it is reasonable for the market, order type, position size, and trading frequency.
Evaluate Out-of-Sample Behavior
A strategy should not be judged only on the same period used to select its rules.
Once parameters and logic have been developed, the system should be evaluated on data that did not drive those decisions.
Forward testing adds another layer by observing how the fixed strategy behaves as new market data arrives.
Neither out-of-sample testing nor forward testing guarantees future performance. Their value is that they make it harder to mistake historical optimization for a persistent edge.
For the broader distinction, see Backtesting vs Forward Testing.
Common Trend-Following Mistakes
Several mistakes repeatedly turn a reasonable trend hypothesis into a fragile trading system.
Optimizing the Perfect Lookback
Testing dozens or hundreds of moving-average lengths, breakout windows, and exit periods until one combination dominates the historical sample is not discovery by itself.
It may simply be selection bias.
The more configurations examined, the greater the chance that some combination will appear impressive by accident.
Parameter stability matters more than finding one spectacular historical setting.
Adding Filters Until the Backtest Looks Clean
A losing period appears.
Add an RSI condition.
Another appears.
Add an ADX filter.
Then a volatility filter.
Then a second timeframe.
Then exclude Mondays.
At some point the strategy may stop representing a coherent hypothesis and become a collection of rules explaining the historical sample.
Every filter should have a defensible role before its performance contribution is examined.
More conditions do not automatically mean more intelligence.
Treating Every Breakout as a Trend
A breakout is an event.
A sustained trend is a market behavior that unfolds afterward.
The strategy cannot know with certainty which breakout will become a major trend when the signal occurs.

That uncertainty is precisely why exit rules and sizing matter.
Ignoring Whipsaw Because the Long-Term Backtest Is Positive
A positive final equity curve does not tell a trader what the experience of running the system looks like.
Trend strategies may experience clusters of failed entries, especially in range-bound markets.
Those periods should be studied directly rather than dismissed because later winners eventually recovered the losses.
Drawdown duration, trade clustering, turnover, and regime-specific behavior can reveal risks that headline return numbers hide.
Ignoring Execution Costs
The mistake becomes more damaging as the strategy becomes faster.
Small gross advantages can disappear when spread, fees, slippage, and market impact are introduced.
This is especially important when comparing two implementations where the faster version looks slightly better before costs.
The economically relevant comparison is not gross signal quality alone.
It is the behavior that remains after plausible implementation costs.
Assuming One Successful Market Proves the Strategy
A trend rule that worked historically on gold has demonstrated something about that rule on that historical gold sample.
It has not automatically demonstrated that the same parameters should work on Bitcoin, EUR/USD, equities, or every other market.
Different markets have different volatility, liquidity, trading hours, participant structures, and directional behavior.
Cross-market testing can provide useful evidence, but parameters should not be transferred blindly.
Assuming Historical Trend Persistence Must Continue
Trend following has substantial historical and academic evidence behind it.
That is not the same as permanence.
Market structure changes. Competition changes. Transaction costs change. Participant behavior changes. Some forms of directional persistence may weaken while others remain.
Research published in 2026 on short-term futures trend following is a useful reminder that an anomaly with a long history can still change materially at particular horizons or within particular market structures.
The appropriate response is not to assume trend following works or does not work.
It is to define the strategy precisely, test the hypothesis honestly, and continue evaluating whether the behavior that justified the strategy remains present.
Where Algorier Fits
Trend following is particularly well suited to rule-based implementation because the strategy can be expressed as explicit conditions.
A trader might have a relatively simple idea:
Trade only in the direction of the long-term trend, enter after a breakout, and exit when the trend reverses.
Or the idea may be significantly more complex, combining multiple timeframes, volatility conditions, trailing exits, position limits, and different rules for long and short trades.
With AlgoBuild, users can describe even complex trading ideas in plain English. Algorier can translate those descriptions into structured algorithms, then backtest and forward test the resulting strategy before live deployment. The Whitepaper specifically includes moving averages, momentum strategies, volatility breakouts, multi-condition systems, multi-timeframe strategies, trailing stops, and other dynamic exit structures among supported strategy types.
That does not mean a vague idea becomes a reliable strategy automatically.
A request such as:
“Build me a profitable trend strategy.”
does not define a meaningful trading system.
The underlying decisions still need to become explicit:
- Which market should the strategy trade?
- Which timeframe should it evaluate?
- How is a trend identified?
- What exactly triggers an entry?
- What invalidates the trade?
- How should positions be sized?
- What limits apply to exposure?
- What ends a winning trade?
The value of automation is not that these questions disappear. It is that once they are defined, they can be translated into consistent rules and evaluated systematically.
From Trading Idea to Testable Rules
Consider a plain-English strategy description such as:
Trade BTC on the four-hour timeframe. Only look for long entries when price is above its 200-period moving average. Enter when price closes above the highest close of the previous 20 completed periods. Use a trailing exit if the trend reverses. Allow no more than one open position.
Illustrative example only. These rules are not a recommendation and have no implied performance.
That description already contains several components of the framework discussed earlier:
- market
- timeframe
- trend filter
- entry condition
- exit concept
- position limit
It can then be refined until every ambiguous component becomes measurable.
For example, “use a trailing exit” is not precise enough on its own. The exit still needs a defined calculation.
The strategy can then be tested rather than debated theoretically.
According to the Algorier Whitepaper, generated algorithms are evaluated through both backtesting and forward testing. Historical and forward-test behavior provide evidence for evaluation, but neither establishes that a strategy will remain profitable in future conditions.
Why the Difference Matters
Converting a trend idea into explicit rules changes the quality of the questions a trader can ask.
Instead of:
Does trend following work?
the trader can investigate:
- Does this definition of trend behave consistently?
- How sensitive is the result to the lookback period?
- What happens during sideways markets?
- How much does the exit rule affect drawdown?
- Does the result survive realistic trading costs?
- Does performance persist outside the development sample?
- Does the same logic behave similarly across different market regimes?
Those are testable questions.
That distinction matters because two traders can both claim to use “trend following” while running systems with almost nothing else in common.
Automation creates consistency. It does not create an edge by itself.

Trend-Following Strategy Checklist
Before considering a trend-following strategy complete, make sure the following questions have explicit answers.
Market and Timeframe
- Which instrument or instruments will the strategy trade?
- Which timeframe generates the signals?
- Does the strategy require data from additional timeframes?
- Are the required market data available at the necessary frequency and quality?
Trend Definition
- What objectively defines an upward trend?
- What objectively defines a downward trend?
- Is there a neutral state in which no position should be taken?
- Are trend conditions evaluated using completed data only?
Entry
- What exact condition triggers entry?
- Does the strategy enter immediately when a trend is detected or wait for confirmation?
- When is the signal known?
- When can the order realistically be executed?
Exit
- What indicates that the trend has failed?
- Does the system use a trailing exit, opposite signal, protective stop, time-based exit, or combination?
- How much short-term noise can occur before the position is closed?
- Are winning and losing trades managed under clearly defined rules?
Position Sizing
- How is trade size calculated?
- Does position size change with account value or volatility?
- Is there a maximum allocation to one position?
- Can several correlated positions be open simultaneously?
Risk
- What is the maximum exposure allowed at one time?
- What happens after a sequence of failed trends?
- Are there portfolio-level limits in addition to trade-level controls?
- Is there a condition that suspends new entries?
Validation
- Has the strategy been tested across favorable and unfavorable periods?
- Were realistic transaction costs included?
- Are nearby parameter values reasonably stable?
- Was part of the data kept outside the development process?
- Has the strategy been evaluated using forward testing?
- Are the weaknesses of the strategy understood rather than hidden?
If several of these questions still have subjective answers, the strategy is not fully specified.
How to Decide Whether a Trend-Following Strategy Is Worth Further Testing
A good historical equity curve is not enough.
The first decision should be whether the evidence justifies spending more time on the strategy.
A useful evaluation sequence is:
1. Check the Economic Hypothesis
Ask why the strategy should work.
“Because the backtest made money” is not an explanation.
For trend following, the hypothesis is usually some form of directional persistence. Historical research provides evidence that this behavior has existed across multiple markets and long periods, but it does not validate any specific implementation automatically. Moskowitz, Ooi, and Pedersen documented time-series momentum across 58 liquid futures instruments, while Hurst, Ooi, and Pedersen later extended historical analysis of trend following back to 1880.
2. Inspect the Distribution of Results
Determine where the historical performance came from.
Was the result driven by:
- many moderately profitable trades
- a small number of exceptional trends
- one asset
- one historical period
- one volatility regime
A profitable aggregate result can conceal extreme dependence on a small part of the sample.
That is particularly relevant to trend following because some models produce asymmetric return distributions characterized by repeated smaller losses and less frequent larger gains. Grebenkov and Serror demonstrate this property analytically in a model of moving-average trend following.
3. Stress the Parameters
Change important lookbacks and thresholds within reasonable ranges.
You are not trying to prove that every variation works.
You are looking for evidence that the strategy is not completely dependent on one historically perfect coordinate.
A sharp performance peak surrounded by poor alternatives should generate skepticism.
4. Examine the Bad Periods
Do not study only the winners.
Identify:
- worst drawdowns
- longest periods without progress
- clusters of false signals
- unfavorable regimes
- unusually high turnover
Then ask whether those outcomes are consistent with how the strategy is supposed to behave.

5. Add Realistic Implementation Friction
Recalculate the strategy after incorporating plausible:
- spreads
- commissions
- fees
- slippage
- execution timing
The faster and more frequently a trend strategy trades, the more important this step becomes.
Recent research also suggests that short-horizon trend profitability may have changed materially in parts of the futures market. Kurth, Eisler, Rej, and Bouchaud report substantial post-2008 deterioration for certain short-term trend signals and connect the differences across contracts to market microstructure. Their 2026 work is a preprint, so its conclusions should be treated as recent research rather than established consensus.
6. Move Beyond the Development Sample
Once the strategy has been designed, stop changing it long enough to see how it behaves on unseen data.
Then observe it forward.
If every disappointing result causes another parameter adjustment, the strategy never truly leaves development.
The purpose of validation is not to obtain a certificate saying the system “works.” It is to progressively eliminate explanations based on accidental historical fit.
Final Verdict
Trend following is not a prediction technique and it is not a single indicator.
It is a strategy framework built around a simple idea: when meaningful directional movement appears, enter according to predefined evidence, remain exposed while the move persists, and exit when the evidence supporting the trend disappears.
That simplicity is both its strength and its trap.
A moving-average crossover or breakout rule can be written in one sentence. A credible trend-following system requires much more: explicit entries, exits, sizing, risk limits, execution assumptions, parameter testing, regime analysis, and out-of-sample evaluation.
Historical research provides substantial evidence that directional persistence has existed across asset classes and long periods. It also provides no reason to assume that every trend signal, parameter, market, or timeframe will continue to produce an exploitable edge.
The practical question is therefore not:
Does trend following work?
It is:
Can this specific trend-following rule set capture enough persistent movement to survive failed signals, costs, changing regimes, and unseen data?
That is the question a serious backtest should attempt to answer.
Frequently Asked Questions
What is a trend-following strategy?
What is the best trend-following strategy?
Moving averages, breakouts, channel systems, time-series momentum, and multi-timeframe approaches can all be used to identify trends. Their behavior depends on the market, timeframe, parameters, exit design, trading costs, and market regime.
A historically superior parameter should not be treated as universally optimal.
What indicators are used in trend following?
The indicator itself is not the complete strategy. A usable system also needs entry, exit, position-sizing, and risk rules.
Is trend following the same as momentum trading?
Trend following is a broad family of strategies designed to capture directional persistence. Time-series momentum is closely related because it uses an asset’s own past direction to determine exposure.
Cross-sectional momentum is different. It ranks assets against one another and typically buys relative winners while avoiding or shorting relative losers.
Does trend following work in sideways markets?
This can create whipsaw, where the strategy enters after one directional signal, exits after a reversal, and may then enter in the opposite direction before price reverses again.
A strategy should therefore be tested specifically during non-trending periods rather than evaluated only during strong trends.
Why are trend-following entries often late?
A trend follower generally waits for evidence that directional movement exists instead of trying to predict the exact reversal point.
Stricter confirmation may reduce some false signals, but it also means entering later. Faster signals react sooner but may respond more frequently to noise.
That tradeoff cannot be eliminated completely.
Can a trend-following strategy have a low win rate and still be profitable?
Win rate does not describe the size of winning trades relative to losing trades.
Some trend-following structures are designed to accept repeated failed signals while remaining exposed to less frequent sustained moves. Whether that produces a positive result depends on the complete return distribution, costs, sizing, and risk controls.
A low win rate is therefore neither proof of a bad strategy nor evidence of a good one.
What markets can trend following be used in?
That does not mean the same parameters should be transferred unchanged from one market to another.
Each implementation should be tested under the characteristics and execution conditions of the market it is intended to trade.
Can trend following be automated?
A systematic implementation needs measurable conditions for trend detection, entry, exit, sizing, and risk management.
Algorier’s Whitepaper states that AlgoBuild can translate natural-language descriptions, including complex and multi-condition trading ideas, into algorithms that can subsequently be backtested and forward tested.
Automation does not guarantee that the rules contain a profitable edge.
What is the biggest weakness of trend following?
Trend followers normally enter after directional evidence has appeared. If the market reverses soon afterward, the strategy can lose. Repeated reversals can create a sequence of losses before another sustained trend develops.
Costs and delayed exits can make this problem worse.
How should a trend-following strategy be validated?
Important questions include whether the strategy survives reasonable parameter changes, unfavorable market regimes, realistic costs, unseen data, and forward testing.
The objective is not to prove future profitability. It is to determine whether the evidence remains credible when the assumptions that produced the original backtest are challenged.
- Moskowitz, Tobias J., Yao Hua Ooi, and Lasse Heje Pedersen. “Time Series Momentum.” Journal of Financial Economics, Vol. 104, No. 2, 2012, pp. 228–250. The study examines time-series momentum across 58 liquid equity index, currency, commodity, and bond futures.
- Hurst, Brian, Yao Hua Ooi, and Lasse Heje Pedersen. “A Century of Evidence on Trend-Following Investing.” The Journal of Portfolio Management, Vol. 44, No. 1, 2017, pp. 15–29. The authors extend trend-following analysis across global markets back to 1880.
- Grebenkov, Denis S., and J. Serror. “Following a Trend with an Exponential Moving Average: Analytical Results for a Gaussian Model.” Physica A: Statistical Mechanics and its Applications, Vol. 394, 2014, pp. 288–303. The paper analyzes the distribution of trend-following profits and losses, turnover, transaction costs, and strategy timescale in a theoretical framework.
- Kurth, Jutta G., Zoltan Eisler, Adam Rej, and Jean-Philippe Bouchaud. “Is Trend Still Your Friend?: A Microstructural Account of the Demise of Short-Term Trend-Following.” arXiv preprint, 2026. The study examines roughly 100 liquid futures contracts from 1995 through 2025 and reports significant changes in short-term trend behavior associated with market microstructure.
- Algorier. Algorier Platform Whitepaper, Version 1.0. July 2026. Product details concerning AlgoBuild, natural-language strategy construction, backtesting, forward testing, supported strategy structures, and deployment are based on the official Whitepaper.
Risk Disclaimer
Trading involves risk, including the possibility of substantial losses. Trend-following strategies can experience losing trades, extended drawdowns, false signals, execution costs, and periods in which historical relationships fail to persist.
Backtests and forward tests describe strategy behavior under specific historical or observed conditions. They do not guarantee future performance.
This article is provided for educational and informational purposes only and should not be considered investment, trading, financial, or personalized professional advice.