

Contents
Why Python Works Well for Algorithmic Trading
Python is popular with algorithmic traders because it’s easy to read and has a library for almost every step of the work. Packages like pandas, NumPy, and TA-Lib make data manipulation, indicator calculation, and strategy analysis easy.

Python also lets you customize every part of a strategy and connect it to live market data, which many pre-built platforms don’t allow. If you want faster results, AlgoBuild lets you describe a strategy in plain English, backtests it, and then runs it live.
Setting Up Your Python Environment
- Install Python & IDE: Python 3.10+ with VS Code or PyCharm.
- Install Libraries:
pip install pandas numpy matplotlib TA-Lib yfinance- Download Market Data: Use yfinance or broker APIs for historical datasets.
Why Environment Matters
Use the same Python and library versions for testing and live trading. Version mismatches are a common reason a strategy behaves differently once it goes live.
Building Your First Trading Strategy
- Define Entry and Exit Rules:
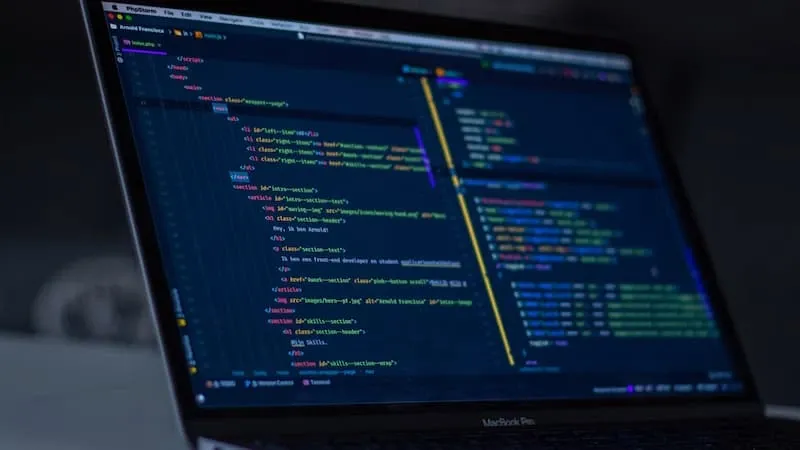
import pandas as pd
import yfinance as yf

data = yf.download("AAPL", start="2022-01-01", end="2023-01-01", multi_level_index=False)
data['SMA_20'] = data['Close'].rolling(20).mean()
data['SMA_50'] = data['Close'].rolling(50).mean()

data['Signal'] = (data['SMA_20'] > data['SMA_50']).astype(int)
The strategy goes long when the 20-day average is above the 50-day average and stays out of the market otherwise.
- Backtest: Calculate profit, loss, and key metrics like win rate and drawdown using pandas.
- Optimize: Adjust SMA periods or risk thresholds based on historical performance.
Pro Tip: In Python, every change to your rules means editing and rerunning code. With AlgoBuild, you can describe the change in plain English and get an updated backtest in minutes.
Backtesting Your Strategy
A backtest shows how your rules would have performed on past data. The most useful metrics to check are:
- Win rate: the percentage of trades that made money
- Profit factor: total gains divided by total losses
- Maximum drawdown: the largest drop in account value from a previous peak
To see the signals on a chart, plot the price and both moving averages with matplotlib:
import matplotlib.pyplot as plt

data['Close'].plot(label='Price')
plt.plot(data['SMA_20'], label='SMA 20')
plt.plot(data['SMA_50'], label='SMA 50')
plt.legend()
plt.show()
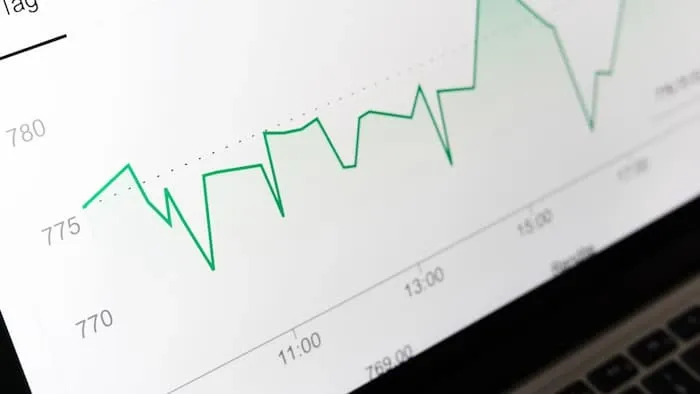
Each point where the two lines cross is a signal, so the chart is a quick way to check that your rules behave the way you expect.
Integrating Python with AlgoBuild
Python gives you full control, but turning a working script into a live strategy takes extra work. AlgoBuild handles that part:
- Convert strategy logic from plain English to executable code.
- Backtest automatically across multiple markets.
- Deploy live 24/7 with user-set risk parameters.
This is useful if you’re new to coding, and it also saves experienced developers from rebuilding the same setup for every strategy.
Advanced Trading Considerations
- Portfolio Diversification: Run several strategies that don’t move together, so one bad period doesn’t hit your whole account.
- Multi-Asset Trading: Test the same strategy on equities, crypto, forex, and commodities. Results often differ a lot from one market to another.
- Monitoring & Alerts: Track performance via Python scripts or AlgoBuild dashboards.
Conclusion and Next Steps
Python is a practical place to start automating your trading. Begin with a simple rule like the moving-average crossover, backtest it with realistic trading costs, and only then think about going live. If you’d rather skip the coding and setup work, AlgoBuild can take your rules from plain English to a live, backtested strategy.

Frequently Asked Questions
Is Python good for algorithmic trading?
Yes. Python is one of the most popular languages for algorithmic trading. It is easy to read, and libraries such as pandas, NumPy, TA-Lib, matplotlib, and yfinance cover data handling, indicators, backtesting, and charts.
Which Python libraries are used for algo trading?
Common choices are pandas and NumPy for working with data, TA-Lib for technical indicators, matplotlib for charts, and yfinance for historical market data. You can add a dedicated backtesting library later as your strategies get more complex.
Do I need to know how to code to trade algorithmically?
No, but coding gives you the most flexibility. If you don’t code, tools like AlgoBuild let you describe a strategy in plain English and turn it into a backtested algorithm you can run live.
How do I backtest a strategy in Python?
Load historical data (for example with yfinance), define your entry and exit rules, simulate the trades on that data, and check metrics such as win rate, profit factor, and maximum drawdown. Include realistic commissions and slippage, or the results will look better than they really are.
Can a profitable backtest still fail in live trading?
Yes. Overfitting, unrealistic execution assumptions, and changing market conditions can all make a strong backtest underperform live. Forward testing on new data before risking real money shows how the strategy behaves outside the period it was built on.